Bitcoin (BTC) has become a household name, revolutionizing the financial world with its decentralized nature and potential for high returns. With its volatile nature, staying updated on the latest Bitcoin price movements is crucial for investors, traders, and enthusiasts alike. A live Bitcoin price chart offers real-time insights, enabling users to make wise decisions in the cryptocurrency market.
Understanding the Live Bitcoin Price Chart
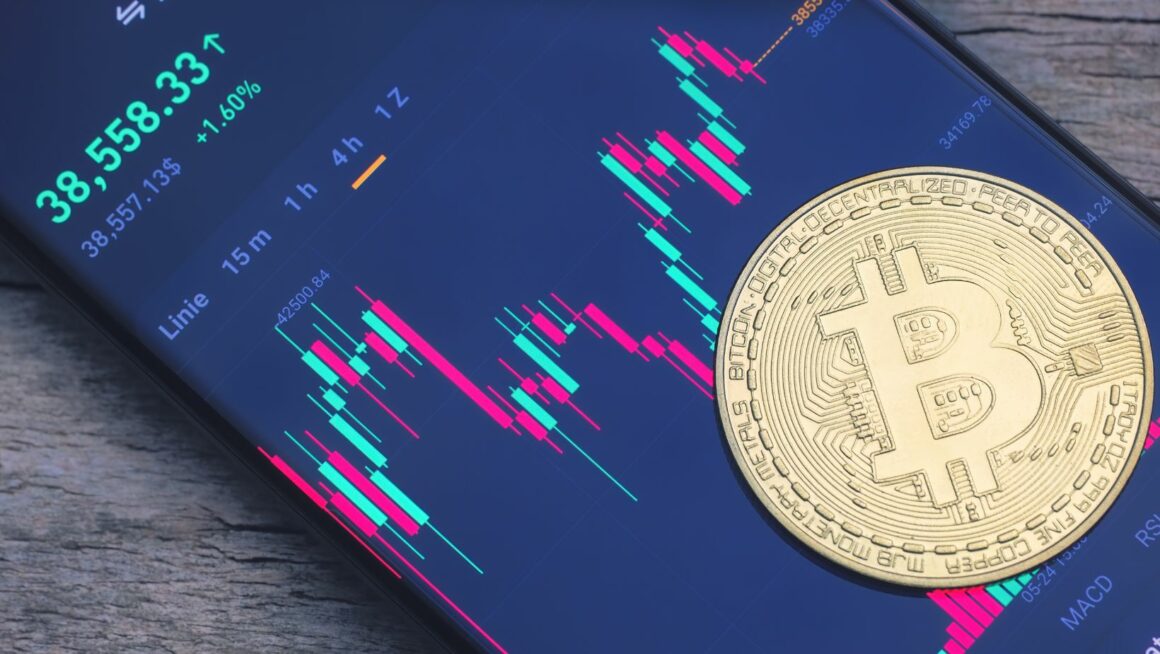
A live BTC price chart is an essential tool that provides up-to-the-minute information about the current value of Bitcoin. This chart displays the Bitcoin price in real-time, reflecting fluctuations influenced by market demand, news, regulatory changes, and macroeconomic factors. By observing these charts, users can identify trends, predict future movements, and execute timely trades.
Key Features of a Live Bitcoin Price Chart
- Real-Time Updates: The most significant feature of a live Bitcoin price chart is its ability to provide continuous, real-time data. This immediacy ensures that users have the latest information, crucial for making quick trading decisions.
- Candlestick Patterns: These charts often use candlestick patterns to represent price movements. Each “candle” displays the opening, closing, and high and low prices within a specified time frame, clearly representing market sentiment.

- Historical Data: In addition to real-time information, these charts provide historical data that allow users to study past trends and price movements, facilitating a better understanding of long-term patterns.

How to Use a Price Chart for Trading
Using a live Bitcoin price chart effectively requires analytical skills and strategic planning. Here’s a step-by-step guide to get you started:
- Set Up Your Chart: Select a reliable platform offering a comprehensive live Bitcoin price chart. Customize the chart settings to display the time frame that aligns with your trading strategy: minutes, hours, days, or weeks.
- Analyze the Trends: Look for trends by examining the candlestick patterns. Uptrends, downtrends, and sideways trends can all be identified through careful chart observation. Recognizing these trends early can provide a significant advantage.
- Apply Technical Indicators: Utilise technical indicators to enhance your analysis. Moving averages help smooth out price data to find the direction of the trend, while RSI can indicate overbought or oversold conditions.
- Set Entry and Exit Points: Depending on your analysis, determine your entry and exit points. This involves setting price levels at which you plan to enter a trade (buy) or exit a trade (sell). Adhering to these points helps maintain discipline and reduce emotional trading.
Benefits of Monitoring a Price Chart
Keeping an eye on a live Bitcoin price chart offers numerous benefits, especially for active traders and investors.

- Informed Decision-Making: Access to real-time data ensures your trading ideas are based on the most current information available. This can improve the accuracy of your trades.
- Immediate Reaction to Market Events: Cryptocurrency markets can react highly to news and events. A price chart lets you respond immediately to significant market changes, capitalizing on opportunities or mitigating potential losses.
- Enhanced Trading Strategies: Continuous monitoring and analysis of live charts enable traders to refine their strategies over time. This ongoing learning process can lead to more effective and profitable trading practices.
A live BTC price chart is an indispensable tool for anyone in the cryptocurrency market. By providing real-time updates and a wealth of analytical tools, these charts empower users to make well-informed trading decisions. Whether a seasoned trader or a newcomer, leveraging the power of a live Bitcoin price chart can improve your trading experience and help you navigate the world of Bitcoin with confidence.